Zee Setash

Up-and-coming data analyst with four years of elementary education experience. After my time teaching, I have gained a unique perspective on data analysis and its practical real-time implementation. Ask me about it sometime!
View My LinkedIn Profile
Virginia Public Schools
As a former teacher, I have great interest in educational data. As an educator, you are constantly looking at data comparing students, classes, schools, and even divisions. Each division wants to be the best. Each school wants to be the best. This lead me to my overarching question:
What are common traits within the best and worst performing schools?
The Data
I taught in Virginia, so my focus in on Virignia public schools. This uses the most recent complete data which is from the 2021- 2022 school year. All of the data is sourced from the Virginia Department of Education which I cleaned and compiled on Kaggle. As there are multiple schools with the same name in different divisions, I created a primary key titled Sch_Div that is present through all of the datasets to ensure there was no confusion over which school was which. The data contains information about:
- State Assessment (SOL) Pass Rates
- Chronic Absenteeism Rates
- Graduation Rates
- Free and Reduced Lunch Eligibility
- State and Federal Funding
- Teacher Experience, Education, and Licensure
- Student Demographic information
In order to define the best and worst schools, I used the end of state testing, the Virginia Standards of Learning (SOL) Test. For my analysis, I excluded schools that are geared towards students with disabilities or behavior issues. The best schools are the schools that ranked in the 95th percentile or above for average pass rate on the SOL tests. These were average pass rates of 88.6 or higher. The worst schools are the schools that ranked in the 5th percentile or below for average pass rate on the SOL tests. These were average pass rates of 38 or below.
Analysis
The images are from my Tableau dashboard.
Geographic Trends
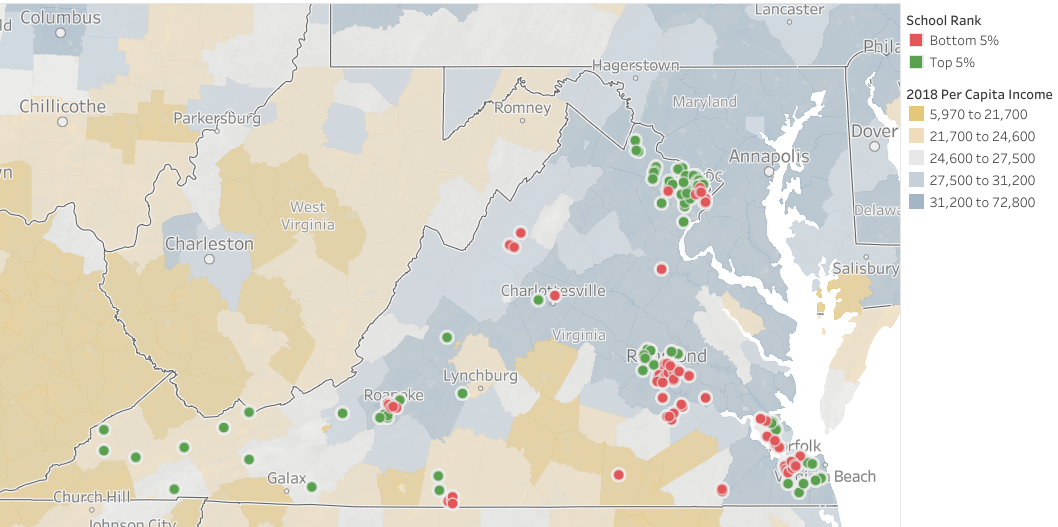
Both the top ranked and bottom ranked schools are gathered near cities. Most of the lower performing schools are in cities. The top schools are more spread out, while the bottom schools tend to be more clustered. There do not appear to be trends based on the per capita income. Both high and low performing schools can be found across the income spectrum by county.
School Funding
.png?raw=true)
The lowest perfoming schools spend more money per pupil. The bottom schools spend $2,000 more per pupil than the top schools on average and $3,000 more per pupil than all other schools on average. By contrast, the higher performing schools spend more money overall on average. There are some costs that are excluded from the per pupil calculation but are included in the total expenditure. According the the VDOE:
Excluded expenditures include adult education, community services, non-regular school day programs, capital purchases, debt service, food services, and fund transfers.
Therefore, the higher performing schools are spending more money on extracurricular activities.
Teacher Quality
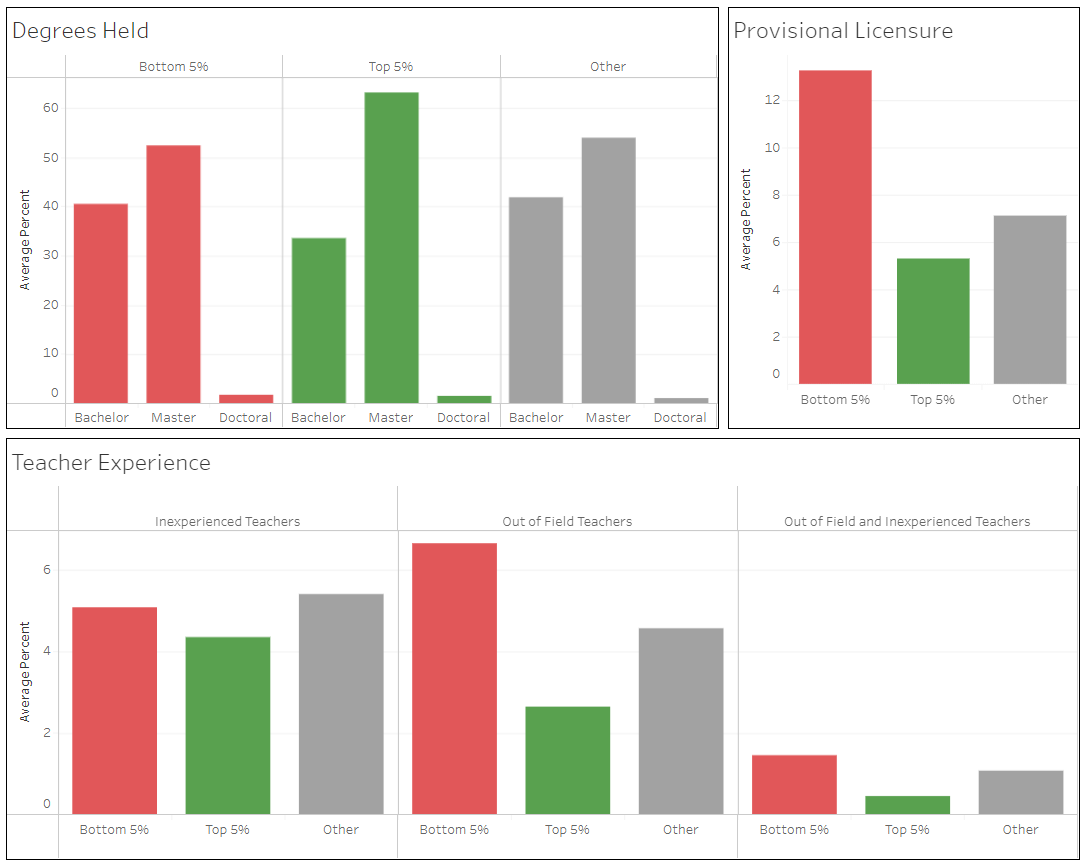
By these metrics, the better performing schools have the more qualified teachers. Across the board, a higher percentage of teachers hold Master’s Degrees than Bachelor’s Degrees alone. This difference in degrees is far more pronounced in the higher performing schools. The lower performing schools have a far greater average percentage of teachers with provisional licenses. These are teachers who are in the classroom with a temporary license and did not go through a teacher preparation course. The lower performing schools are also far more likely to have inexperienced teachers. They are more likely to have teachers that are new, not endorsed in their subject, or both.
Student Demographics
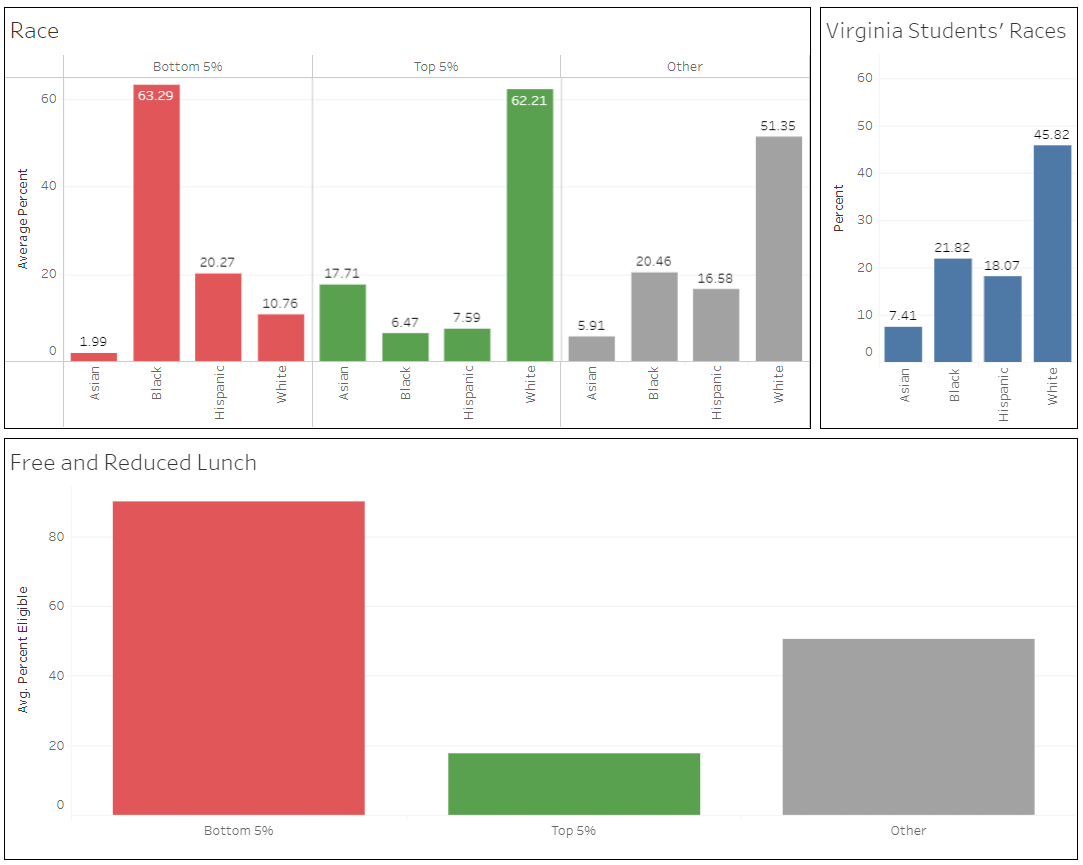
The racial breakdown of the the top and botttom schools are out of proportion with the breakdown of all students in the state. Schools that underperform have a disproportionately high percent of Black students and a disproportionately low percent of White and Asian students. The reverse is true for the higher performing schools, as well as having a disproportionately low percent of Hispanic students.
Students who attend lower performing schools are far more likely to be eligible for the free and reduced lunch program. While there did not appear to be economic trends at the county level from the map above, there are clear economic trends at the school level.
Student Behavior

Lower performing schools have a far lower graduation rate on average. Unsurprisingly, this also means they have a far higher than average dropout rate. The lowest performing schools have an average of 32% of the student body that misses more than 10 days of school in a single year (chronically absentee). The highest performing schools are near average in terms of graduation and dropout rates, however the rate of chronic absences is far lower than average.
Conclusions
The goal for the Virginia Doepartment of Education should be for every student to be capable of graduating and having a successful future. There should not be schools that have more than half of the students failing the end of year testing. Not every school can perform like the top 5%, but the gap between the top and bottom must be narrowed.
Key Findings and Reccommendations
- The schools that are outliers in performance have disproportionate racial breakdowns.
School boundaries need to keep race in mind. Virginia has a history of resisting the integration of schools, even in the 2020’s, more of an effort needs to be made to fully integrate our schools.
- The lowest performing schools have lower quality teachers.
There need to be greater incentives for quality teachers to work at the underperforming schools. Teachers should be compensated more working at these schools, regardless of the division salary.
- Students who attend lower performing schools are far more likely to be eliglible for the free and reduced lunch program.
More supports need to be in place for these students. They are more likely to need to work to support their families and less likely to be able to devote the same time to their studies as other students. Resources to bring down these barriers are necessary.
Thank You
Thank you for taking the time to read my report. This was a very personal project for me. Please reach out at azsetash@gmail.com